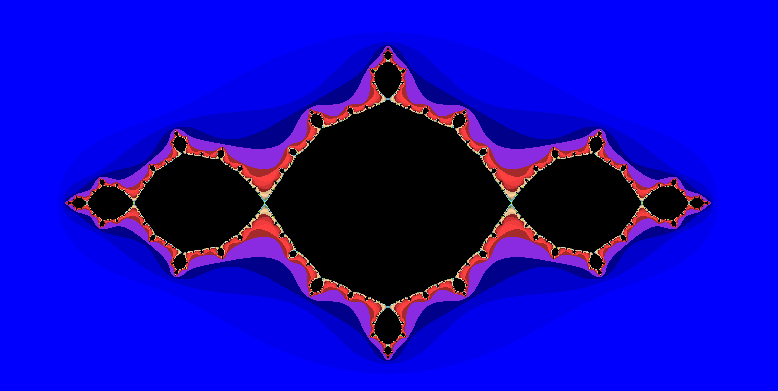
This article explains how to create some fractal plots with graphics.py, a popular graphics library for Python written by John Zelle. Graphics.py is a single file containing graphics functions such as Point, Line, Circle and Rectangle. Elsewhere on this blog, it’s been used to create sinusoidal patterns, including a Mexican hat/blancmange surface. This article focuses on the creation of fractal images.

