Simple Julia and Mandelbrot Sets with Python

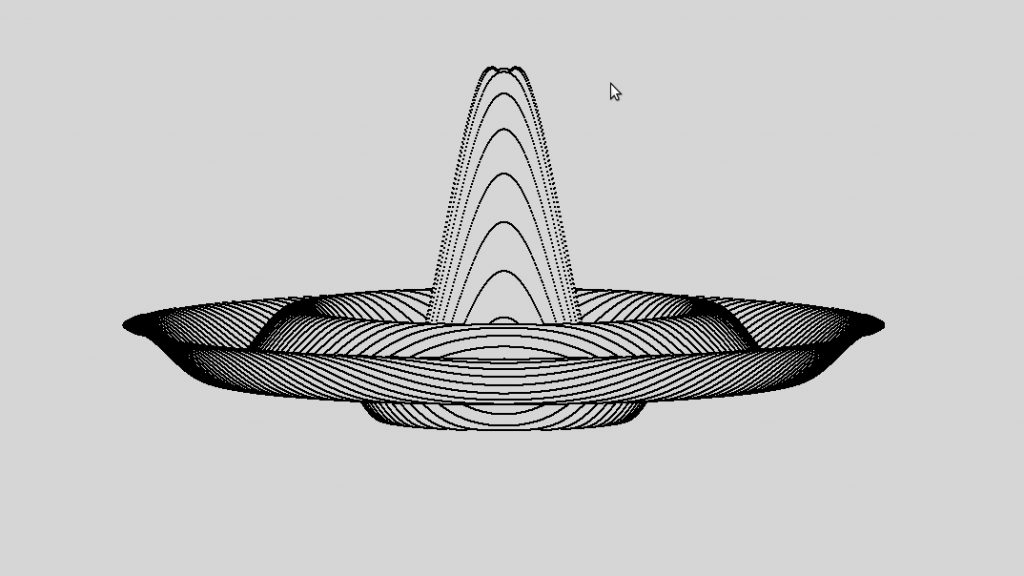
This article explains how to create some fractal plots with graphics.py, a popular graphics library for Python written by John Zelle. Graphics.py is a single file containing graphics functions such as Point, Line, Circle and Rectangle. Elsewhere on this blog, it’s been used to create sinusoidal patterns, including a Mexican hat/blancmange surface. This article focuses on the creation of fractal images.
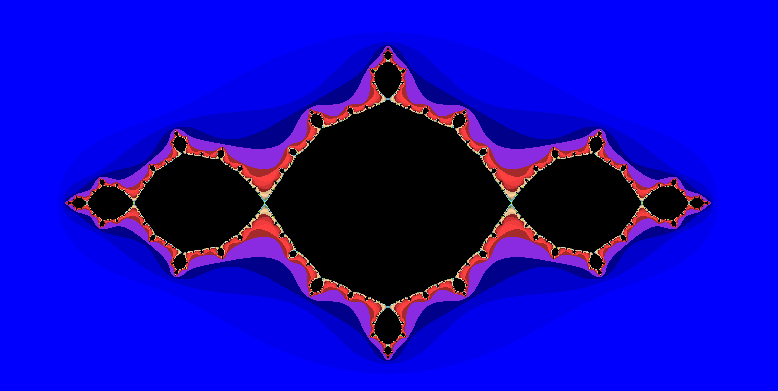
Plot 1. A Julia set, c = -1+j0
Continue reading

Messing Around with Graphics.py

This article explains how to create some simple mathematical shapes with graphics.py, a popular graphics library for Python written by John Zelle. Graphics.py is a single file containing graphics functions such as Point, Line, Circle and Rectangle. In this article though, we are just going to use it to plot single points.

At the top of the page is a blancmange like shape. The program that drew it is at the bottom of the article, if you want to jump straight there.  Otherwise, a couple of simpler plots will be demonstrated first, just to show a couple of underlying principles. Continue reading