Simple Julia and Mandelbrot Sets with Python

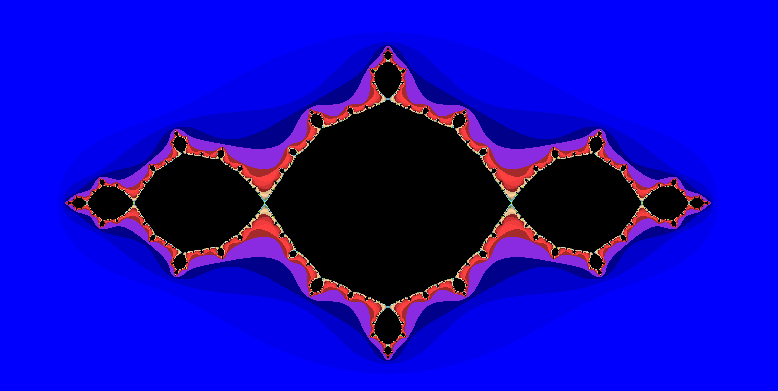
This article explains how to create some fractal plots with graphics.py, a popular graphics library for Python written by John Zelle. Graphics.py is a single file containing graphics functions such as Point, Line, Circle and Rectangle. Elsewhere on this blog, it’s been used to create sinusoidal patterns, including a Mexican hat/blancmange surface. This article focuses on the creation of fractal images.

Plot 1. A Julia set, c = -1+j0
Continue reading

Messing Around with Graphics.py

This article explains how to create some simple mathematical shapes with graphics.py, a popular graphics library for Python written by John Zelle. Graphics.py is a single file containing graphics functions such as Point, Line, Circle and Rectangle. In this article though, we are just going to use it to plot single points.

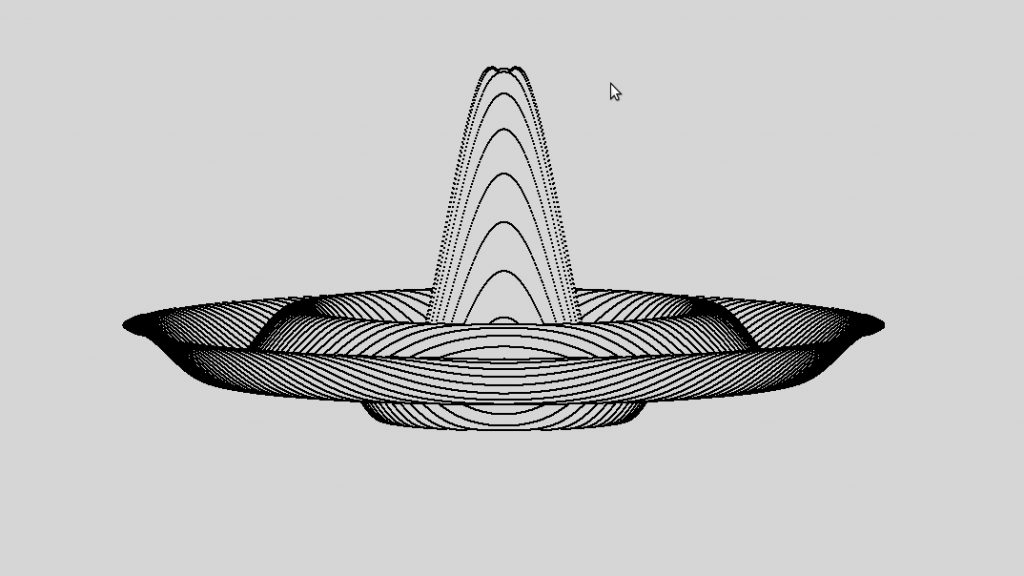
At the top of the page is a blancmange like shape. The program that drew it is at the bottom of the article, if you want to jump straight there.  Otherwise, a couple of simpler plots will be demonstrated first, just to show a couple of underlying principles. Continue reading

Complex Data Structures in Python

Most programming languages offer the facility for making large, compound data structures. For example C, Pascal, Perl and Python. A few simple data types are provided, out of which larger structures can be built. A programmer can store data in a whatever way is most suitable for the application.

Often, a simple list or dictionary will be enough. Read the data in, process it, and print the results out. Perfect. But for a larger or more useful application, more data, and more kinds of data, will need to be stored and processed at the same time.

This article demonstrates the building of a complex data structure in Python. Note: it is not about classes, or object oriented programming, just the syntax for handling complex data structures, made up of lists, dictionaries and simple strings and integers. Continue reading